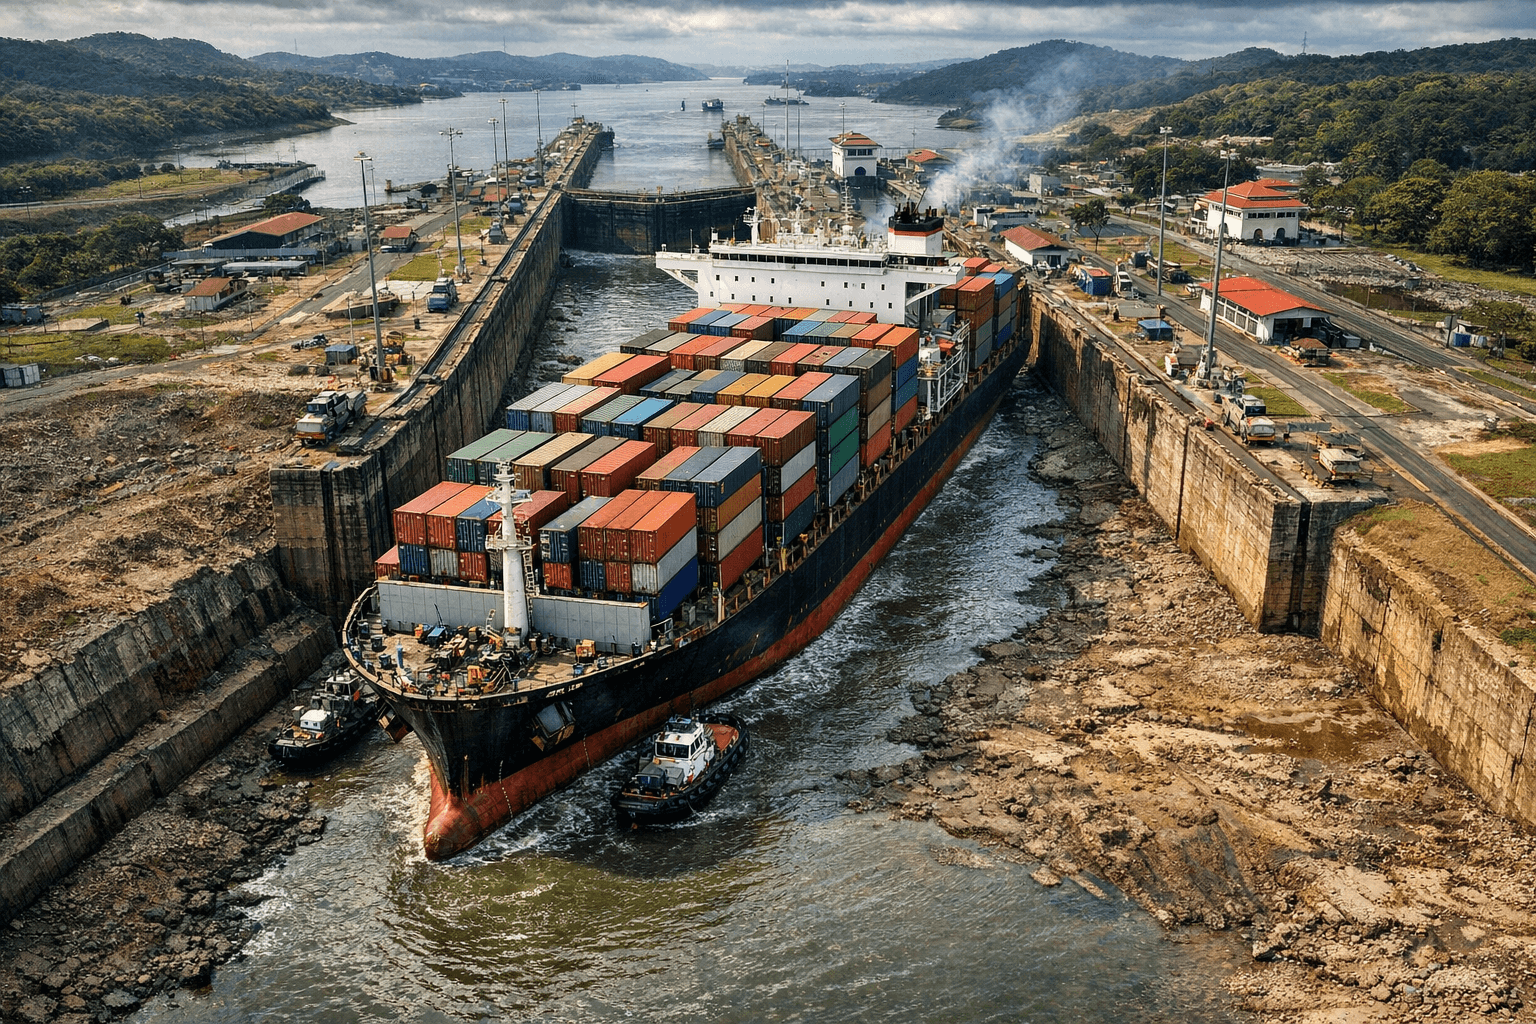
Panama Canal: An Ongoing Challenge
The Panama Canal continues to face capacity constraints in 2026. While conditions have improved from the 2023-2024 severe drought, the canal remains below full capacity due to climate challenges and infrastructure limitations, with significant implications for global shipping.
Current Capacity Situation
Transit Numbers
- Pre-drought: 38-40 transits per day
- Peak drought (2023): Down to 22 transits
- Current (2026): 32-36 transits per day
- Gatun Lake water levels monitored daily
Depth Restrictions
- Maximum draft reduced during low water
- Affects Neopanamax vessel capacity
- Tonnage impact: 15-25% reduction typical
- Some vessels require weight reduction
Causes of Constraint
Climate Change Impact
- El Niño and drought cycles
- Reduced rainfall patterns
- Watershed stress
- Fresh water competing needs
Infrastructure Limits
- Gatun Lake capacity fundamental constraint
- Original 1914 locks still in use
- Neopanamax locks (2016) require water-saving basins
- Fresh water from rainfall only
Industry Adaptations
Routing Alternatives
- Suez Canal routing for Asia-US East Coast
- US West Coast + intermodal rail
- Strait of Magellan for South America routes
- Trans-Pacific + Panama split strategies
Vessel Operations
- Reduced drafts voluntarily
- Partial loading for transits
- Schedule adjustments for reservations
- Booking auctions for priority transits
Economic Impact
Canal Surcharges
- Special fee structures implemented
- Weather-related charges applied
- Booking premium auctions
- Pass-through to shippers as surcharges
Cost Impact on Cargo
- Ocean freight premiums on affected lanes
- Alternative routing adds 5-15 days transit
- Fuel costs elevated for longer routes
- Asia-US East Coast rates elevated
Transit Time Changes
Asia to US East Coast
- Panama Canal route: 28-35 days (normal)
- Via Panama with delays: 32-40 days
- Suez Canal route: 35-42 days
- Cape of Good Hope: 42-50 days
South America Routes
- West Coast South America to Europe
- Delays add 5-10 days typical
- Some rerouting via Strait of Magellan
- Seasonal variations significant
Booking and Scheduling
Slot Reservations
- Advance booking system
- Priority transit auctions
- Premium fees for guaranteed slots
- Complex booking requirements
Vessel Planning
- Shippers working directly with carriers
- Alternative sailings reserved
- Multi-route contingency plans
- Flexibility premium on contracts
Long-Term Solutions
Panama Canal Authority Investments
- Gatun Lake expansion studies
- Water recycling technology
- Additional reservoir planning
- Rio Indio dam project
Industry Responses
- Permanent diversion of some services
- Regional supply chain shifts
- US West Coast capacity investment
- Intermodal rail expansion
Implications for Importers
Transit Time Planning
- Build in buffer for potential delays
- Understand alternative routing options
- Monitor canal conditions regularly
- Communicate with freight forwarders
Cost Management
- Expect variability in Asia-East Coast rates
- Evaluate total landed cost comparisons
- Consider multi-route strategies
- Lock in rates for predictability
Alternative Routing Comparison
Suez Canal via Mediterranean
- Longer but avoids Panama constraints
- Red Sea security concerns factor
- Mediterranean port transshipment options
- Different vessel class capabilities
US West Coast + Rail
- Faster ocean transit to LA/LB
- Rail to Chicago, Memphis, Dallas
- Total time often comparable to Panama
- Better for time-sensitive cargo
2026 Outlook
The Panama Canal situation continues to evolve. Expect:
- Gradual improvement with infrastructure investment
- Climate-driven variability to continue
- Capacity management becoming permanent
- Pricing reflecting constraints
- Alternative routes maintaining higher volumes
Smart shippers are building flexibility into their supply chains rather than depending on any single route. This strategic resilience pays dividends when disruptions occur.